Jonathan McGechie

About Me
I am completing my final semester of a master’s program in Data Science, with a keen interest in transitioning into the field of Data Engineering. My technical skills include proficiency in PostgreSQL, Python, PowerBI, and SmartSuite, along with working knowledge in R, Tableau, and gitbash. Throughout my academic and professional journey, I have gained valuable experience working with various software platforms, including Salesforce, Dynamics AX ERP, and PLM systems.
I specialize in managing large datasets and performing detailed End-of-Life analyses for products. My role often involves acting as an interdisciplinary liaison, effectively bridging communication and collaboration between different departments and leadership teams. My goal is to leverage my technical expertise and analytical skills to drive data-driven decision-making and foster innovation in dynamic and challenging environments.
Ways to Contact
View My LinkedIn Profile
View My HTML page
Resume
Email
Certifications
SmartSuite Pro — SmartSuite Expert — SmartSuite Consultant
Projects
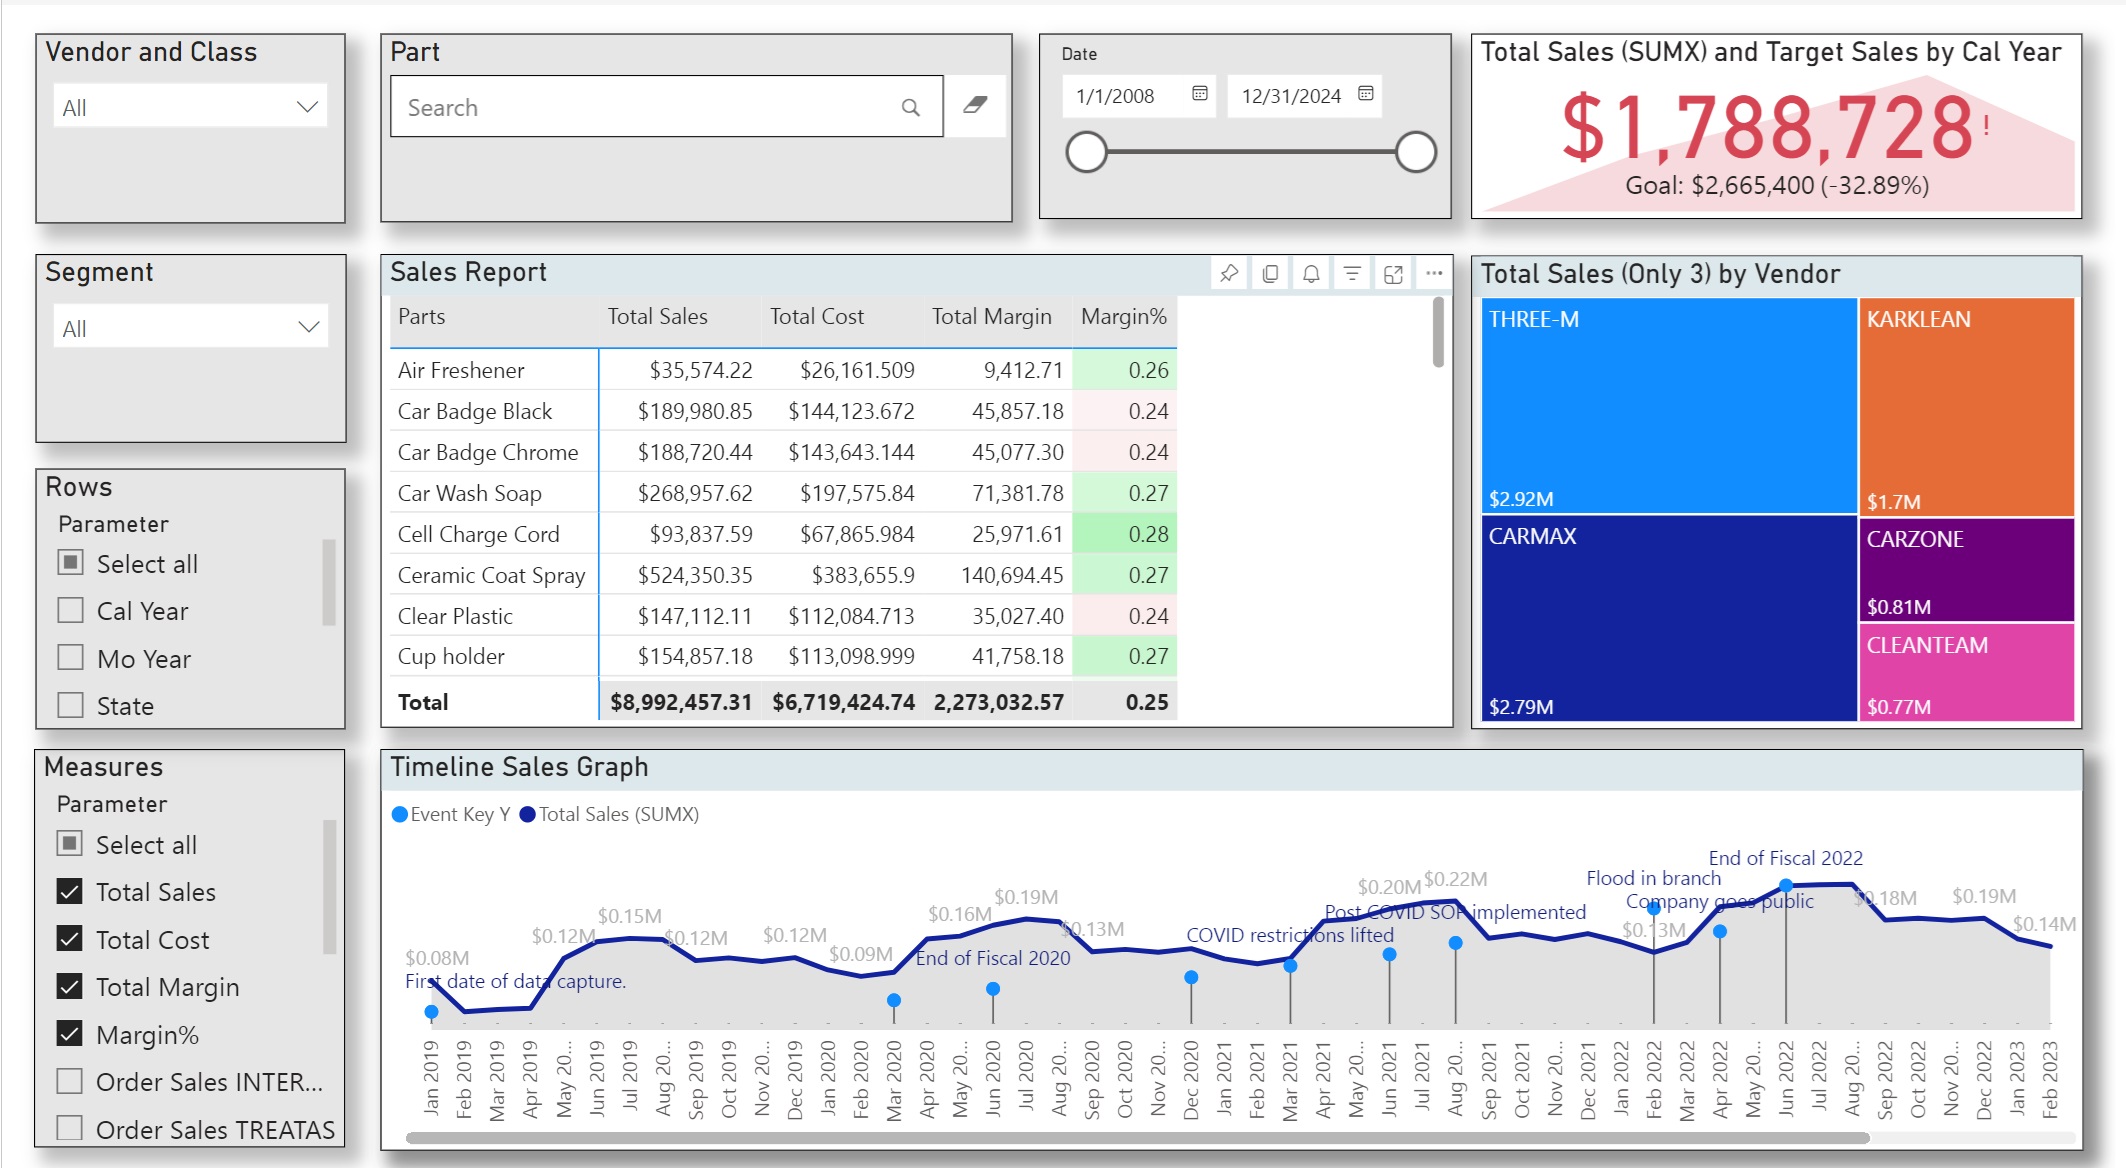
Product Sales & Company Insights Dashboard
Welcome to the Product Sales & Company Insights Dashboard, a comprehensive tool designed to analyze product sales and track purchasing companies. This interactive dashboard, created as part of a final class project, offers detailed insights into:
1) Sales Performance: View and analyze sales data for various products.
2) Company Information: Access details about companies making purchases.
3) Geographic Distribution: Explore the locations of these companies on an interactive map.
This dashboard utilizes data provided through an Excel file, supplied by our Professor, and has been developed using Power BI. To access the live version of the dashboard, please click the link below. Note that you may need to log in with a Microsoft Account.
Machine Learning Class Presentation
In this presentation for our Machine Learning class, we delve into the details of our project, which involved applying various machine learning models to a real-world dataset. We begin by explaining how we structured and preprocessed the data to make it suitable for analysis. Our exploration of different machine learning models highlighted that the Random Forest Classifier achieved the highest accuracy compared to the other models we tested.
The primary goal of this project was to gain practical experience with different machine learning techniques and to apply these methods to a real-life scenario. For a comprehensive view of our findings and methodologies, you can access the full presentation.

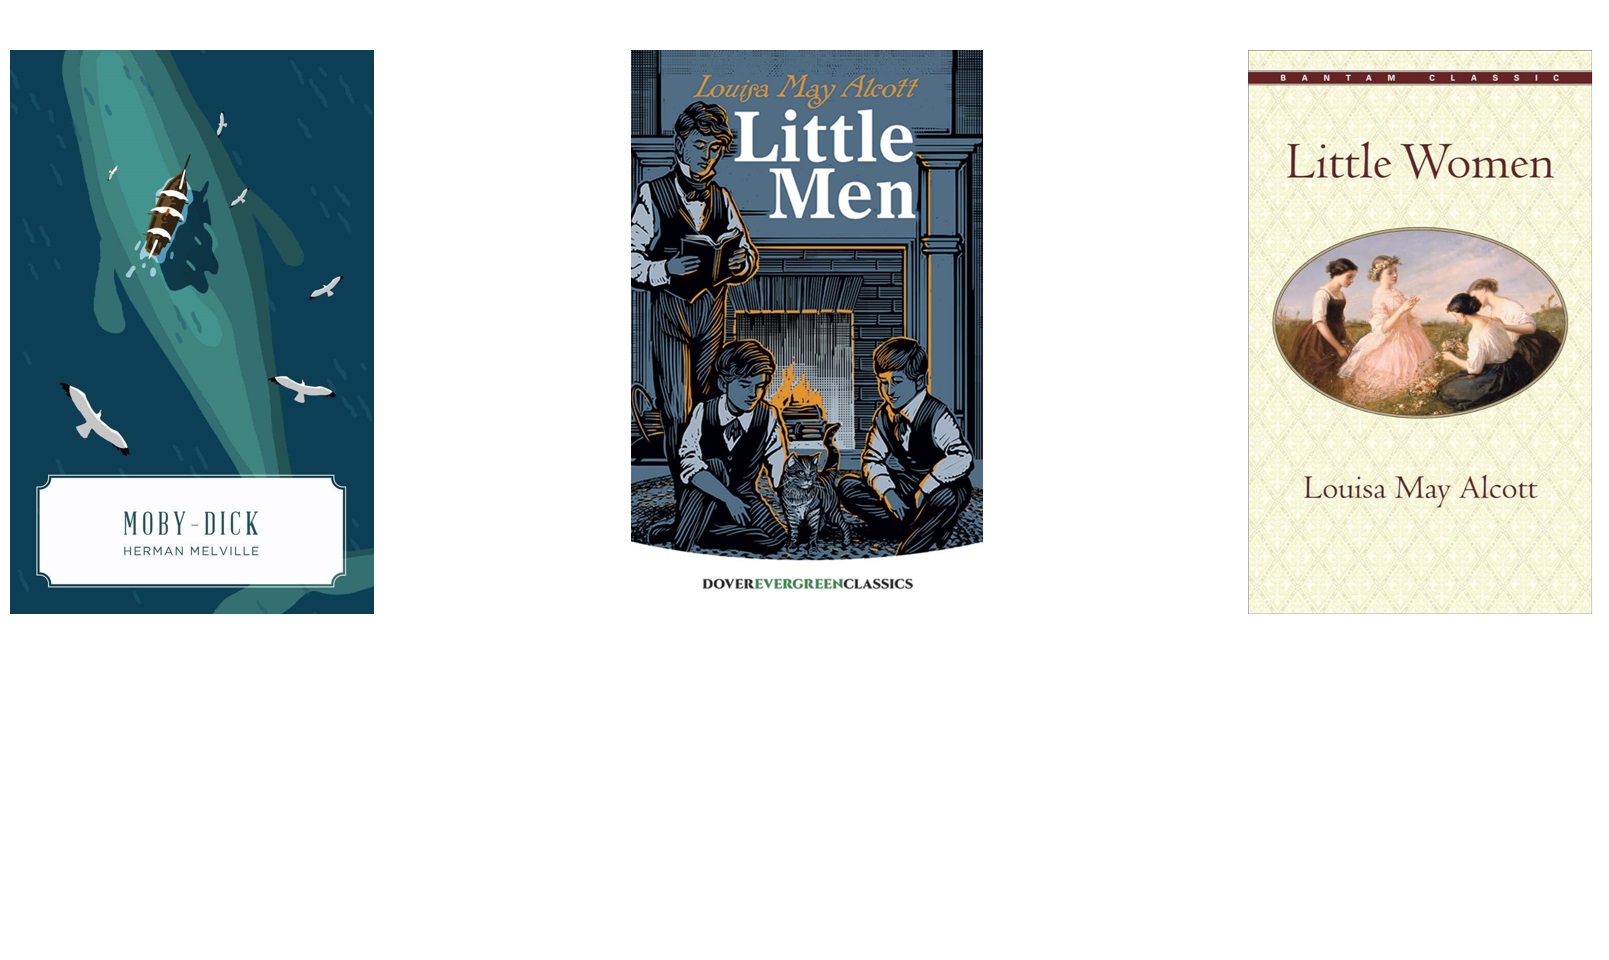
NLP Class Activity: Analyzing Literary Texts
In this class activity, I collaborated with a partner to develop a Natural Language Processing (NLP) algorithm aimed at analyzing the use of masculine and feminine subject and objective pronouns in three classic novels: Moby Dick, Little Women, and Little Men.
The objective of our NLP analysis was to examine the distribution and usage patterns of these pronouns across the texts, providing insights into gender representation and linguistic trends within these literary works.
Exploring the Barriers to Affordable Housing in Oregon
For our capstone project, we conducted an in-depth analysis of the affordable housing landscape in Oregon. Working closely with my project partner, we demonstrated various aspects of our graduate education, including Data Engineering, Data Visualization, Machine Learning, Statistical Thinking, and Data Ethics. Our project involved both a comprehensive write-up and a presentation.
Through our research, we discovered that Oregon faces a significant deficit in available homes. However, the state has begun implementing measures to address this issue. Notably, legislation has been enacted requiring all counties to report housing data and make it publicly accessible. Despite these efforts, we observed a lack of historical land sale records, which complicates the analysis. Additionally, we found that house prices in less populated counties are often inflated due to the inclusion of land with the home.
One of the key legislative initiatives is H.B. 2001, aimed at making homeownership more affordable in Oregon. While this is a positive step, our findings suggest that further action is needed to fully address the housing affordability crisis.

Final project for Intro SaaS/ProServ Sales
In our final project for the Intro to SaaS/ProServ Sales course, we developed a comprehensive sales pitch for Wide World Importers, focusing on addressing a key challenge within their operations. Our solution centered around enhancing their refrigeration trucks by integrating advanced monitoring, recording, tracking, and repair systems for their tractor trailers.
We proposed a cutting-edge solution designed to streamline and optimize the management of refrigeration units. This included real-time monitoring to ensure consistent temperature control, recording data for compliance and analysis, and tracking system performance to predict maintenance needs. Additionally, we introduced a repair management component to minimize downtime and ensure the efficiency of the fleet.
Our pitch aimed to showcase how these enhancements could improve operational efficiency, reduce costs, and ensure the reliability of refrigerated transport, ultimately delivering substantial value to Wide World Importers.

Current Projects
Expansion of Midterm Project Bookshelf
Project Overview: Personal Reading Tracker (SQL + Python + Power BI)
This project is a continuation of a database-focused assignment I began during my Master’s program, where we were tasked with solving problems using SQL commands such as JOINs, GROUP BY, and others. I have since expanded the dataset to include a personal collection of books I have either read, am currently reading, or plan to read (TBR – To Be Read).
The project is divided into three phases:
Phase 1: Database Design and SQL Integration
1) Created and populated three distinct PostgreSQL tables:
2) Books (book titles, authors, page count, etc.)
3) Reading_Status (read, currently reading, TBR)
4) Book_Metadata (genre, rating, date added)
5) Used SQL joins to combine these tables into a comprehensive dataset for analysis.
6) Sample SQL queries were used to answer basic questions like:
7) Total number of books in each category
8) Average page count by reading status
9) Most frequent genres in TBR list
Phase 2: Python Data Analysis
1) Used Pandas and Matplotlib/Seaborn for data manipulation and visualization.
2) Analyzed trends such as:
3) Distribution of page counts across statuses
4) Total pages read vs. remaining pages (TBR)
5) Author frequency and book counts
6) Derived insights from SQL output for more advanced exploration.
Phase 3: Power BI Dashboard
1) Built a dynamic dashboard visualizing:
2) Number of books in each reading status
3) Total pages read, in-progress, and remaining (TBR)
4) Breakdown by genre, author, or year added
5) Configured the report to auto-refresh from the PostgreSQL database to ensure up-to-date tracking.
This project demonstrates my ability to integrate database management, data analysis, and business intelligence tools to track personal goals and insights. It showcases end-to-end data handling, from structured data modeling to clear and interactive reporting.
Covid vaccination rate and deaths